Matplotlib 绘图实用大全
创始人
2024-06-01 07:56:28
0次
本文只介绍最简单基本的画图方法
预设
要想画出来的图有些逼格,首先应该进行如下设置
plt.rcParams['font.sans-serif']=['SimHei']    #画图时显示中文字体
plt.rcParams['axes.unicode_minus'] = False     #防止因修改成中文字符,导致某些 unicode 字符不能显示
plt.subplots_adjust(left=None, bottom=None, right=None, top=None,wspace=0.3)    #设置制子图之间的左右间距,left 等是设置画图区域与画布之间的间font1 = {'family' : 'SimHei',
'weight' : 'normal',
'size'   : 15,
}   #设置图例(legend)文字的格式的
绘制多幅图
基本格式:
fig = plt.figure(figsize=())
ax1 = plt.subplot(m,n,1)  #m 为行、n为列、1 为图序
plt.plot(xxxxx)ax2 = plt.subplot(m,n,2)
plt.plot(xxxx)......
示例如下:
```python
import matplotlib.pyplot as plt
import numpy as np
x = np.linspace(0,2*np.pi,100)
y1 = np.sin(x)
y2 = np.cos(x)
y3 = x+1fig = plt.figure(figsize=(12,4))  #宽度、高度
ax1 = plt.subplot(1,3,1)
plt.plot(x,y1,linewidth=1.5,color='c',label=r'$y_1$',marker='o',markersize=4)
plt.xlabel('x',fontsize=24)
plt.ylabel(r'$y_1$',fontsize=24)
plt.ylim([-1,1])
plt.xlim([0,2*np.pi])
plt.legend(prop=font1,loc='best')
plt.grid()ax2 = plt.subplot(1,3,2)
plt.plot(x,y2,linewidth=3,color='r',label=r'$y_2$',linestyle='-.')
plt.xlabel('x',fontsize=24)
plt.ylabel(r'$y_2$',fontsize=24)
plt.ylim([-1,1])
plt.xlim([0,2*np.pi])
plt.legend(prop=font1,loc='best')
plt.grid()ax3 = plt.subplot(1,3,3)
plt.plot(x,y3,linewidth=1.5,color='b',label=r'$y_3$',linestyle='--')
plt.xlabel('x',fontsize=24)
plt.ylabel(r'$y_3$',fontsize=24)
plt.legend(prop=font1,loc='best')
plt.grid()

另外。plt.title 也可以设图片的标题,子图的标题也行
画骨骼图
先看效果:

这里要用 axe 来画图,而不能直接用 plt,代码如下:
def sigmoid(x):return 1./(1.+np.exp(-x))def relu(x):return np.where(x<0,0,x)def tanh(x):return 2*sigmoid(2*x)-1font1 = {'family' : 'Times New Roman',
'weight' : 'normal',
'size'   : 14,
}def plot_tran_fun():   plt.rcParams['font.sans-serif']=['SimHei']plt.rcParams['axes.unicode_minus'] = Falsefig = plt.figure(figsize=(8,6))ax1 = plt.subplot(2,2,1)x = np.arange(-10, 10)y = sigmoid(x)ax.spines['top'].set_color('none')ax.spines['right'].set_color('none')ax.xaxis.set_ticks_position('bottom')ax.spines['bottom'].set_position(('data',0))ax.set_xticks([-10,-5,0,5,10])ax.yaxis.set_ticks_position('left')ax.spines['left'].set_position(('data',0))ax.plot(x,y,label="Sigmoid",color = "blue")plt.legend(prop=font1,loc='lower right')
#    plt.show()
#
#    ax2 = plt.subplot(2,2,2)x = np.arange(-10, 10)y = tanh(x)ax.spines['top'].set_color('none')ax.spines['right'].set_color('none')ax.xaxis.set_ticks_position('bottom')ax.spines['bottom'].set_position(('data',0))ax.set_xticks([-10,-5,0,5,10])ax.yaxis.set_ticks_position('left')ax.spines['left'].set_position(('data',0))ax.plot(x,y,label="Tanh",color = "blue")plt.legend(prop=font1)
#    ax.show()
#    ax = fig.add_subplot(223)
#     x = np.arange(-10, 10)y = relu(x)ax.spines['top'].set_color('none')ax.spines['right'].set_color('none')ax.xaxis.set_ticks_position('bottom')ax.spines['bottom'].set_position(('data',0))ax.set_xticks([-10,-5,0,5,10])ax.yaxis.set_ticks_position('left')ax.spines['left'].set_position(('data',0))ax.plot(x,y,label="ReLU",color = "blue")plt.legend(prop=font1)
#    ax = fig.add_subplot(224)
#     x = np.arange(-10, 10)y = xax.spines['top'].set_color('none')ax.spines['right'].set_color('none')ax.xaxis.set_ticks_position('bottom')ax.spines['bottom'].set_position(('data',0))ax.set_xticks([-10,-5,0,5,10])ax.yaxis.set_ticks_position('left')ax.spines['left'].set_position(('data',0))ax.plot(x,y,label="Linear",color = "blue")plt.legend(prop=font1)plot_tran_fun()
其他画图
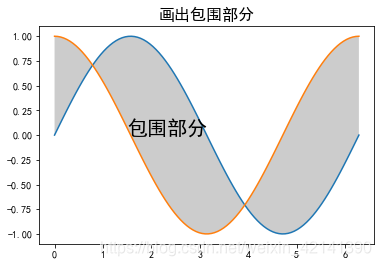
画出包围部分
一般用在画积分面积的时候,代码如下:
fig = plt.figure(figsize=(6,4))
plt.plot(x,y1,x,y2)
plt.fill_between(x,y1,y2,facecolor='k',alpha=0.2)
plt.text(1.5,0,'包围部分',fontsize=20)
plt.title('画出包围部分',fontsize=16)
散点图
plt.scatter(x,y,s=None,c=None,marker=None,alpha=None)
其中 s 为每一个点的大小,若传入的是一个列表或者 array,则array匹配每一个点的大小; c 表示点的颜色,若传入的是列表或者 array,则匹配每一个点的颜色
from sklearn.datasets import make_gaussian_quantiles
X, y = make_gaussian_quantiles(n_samples=300,n_features=2, n_classes=2)  #产生数据集
X0 = X[y.ravel()==0]
plt.scatter(X0[:, 0], X0[:, 1], marker='o')
X1 = X[y.ravel()==1]
plt.scatter(X1[:, 0], X1[:, 1], marker='x')

柱状图
plt.bar(x,height,width,color)
其中 height 是柱状图的高度,即 y;
x = np.arange(10)
y1 = np.random.randn(10)
y2 = np.random.randn(10)
fig = plt.figure(figsize=(6,4))
plt.bar(x,y1,width=0.35,color='g')
plt.bar(x+0.35,y2,width=0.35,color='b')
plt.xlabel('x',fontsize=16)
plt.ylabel('y',fontsize=16)

饼状图
plt.pie(x,labels=None,explode=None,colors=None,autopct=None)
其中:x 为待表示数据;label 接受一个 array,分别对应 x 的标签,explode 接受 array,表示饼状图离圆心的距离(用半径的百分比表示);colors 可以接受 array,表示每一个饼的颜色,autopct 是设置比例的表示方法,如 %1.1f %%(第二个 % 是为了转意)
x = [15,20,30,40]
explode = [0.05]*len(x)
autopct = '%1.1f %%'
labels = ['one','two','three','four']
fig = plt.figure(figsize=(6,4))
patches,l_text,p_text = plt.pie(x,labels=labels,explode=explode,autopct=autopct)
#l_text,p_text 是为了设置饼状图的文本。l_text 是labels的文本,p_text 是图内部的文本(比例)
for t in l_text:t.set_size(30)
for t in p_text:t.set_size(20)

箱型图
plt.boxplot(df,sym,meanline)
df:为箱型图绘制的数据,以列为单位进行绘制
sym:为异常点的形状
meanline:是否展示平均线
import pandas as pd
df = pd.DataFrame(np.random.randn(5,4),columns=['A','B','C','D'])
fig = plt.figure(figsize=(6,4))
plt.boxplot(df,sym='o',meanline=True)

若要设置 xticks,则需要用到 ax,如下:
df = pd.DataFrame(np.random.randn(5,4),columns=['A','B','C','D'])
fig = plt.figure(figsize=(6,4))
ax = plt.subplot()ax.boxplot(df,sym='o')
ax.set_xticklabels(['A','B','C','D'])
频率直方图
import pandas as pd
x = np.random.normal(0,1,size=(100))
fig = plt.figure(figsize=(6,4))
bin_num = 10
plt.hist(x,bin_num)

下一篇:学生信息表
相关内容
热门资讯
售后申请报告范文18篇
售后申请报告范文 第一篇亲爱的领导:从我踏出校门的那一刻,满怀壮志的灵魂早已被阴暗的墙壁磨损殆尽。由...
签证专员辞职申请书
签证专员辞职申请书 随着时代在进步,我们会经常使用申请书,请注意不同种类的申请书有着不同的格式。写...
工伤职工申请补偿书范文通用1...
工伤职工申请补偿书范文 第一篇(一)治(医)疗费。治疗工伤所需费用必须符合工伤保险诊疗项目目录、工伤...
村干部入党申请书
最新村干部入党申请书(通用4篇) 在当今社会高速发展的今天申请书起到的作用越来越大,申请书可以使我...
案件答疑申请书范文(推荐5篇...
案件答疑申请书范文 第一篇【申请人理由】上诉人在《民事上诉状》已上诉:一审法官、一审判决书混淆了原告...
申请仲裁书
申请仲裁书模板 申请人:名称:________ 地址:________________ 法定代表...
助学金申请理由简短
助学金申请理由简短200字 新的学期开始了,又到申请助学金的时候,那么助学金申请理由怎么写?本文是...
向法院申请强制执行申请书
向法院申请强制执行申请书(精选12篇) 现今社会公众的追求意识不断提升,申请书起到的作用越来越大,...
技术转让专利申请权合同
技术转让(专利申请权)合同合同编号:_________项目名称:_________受让方(甲方):_...
济南公租房申请条件
济南市明确了公租房的申请条件和流程,其中申请条件又分为家庭申请和单身申请、济南市户籍申请和非济南...
大学生贫困助学金申请书
大学生贫困助学金申请书(精选10篇) 在这个高速发展的时代,申请书在生活中的使用越来越广泛,写申请...
职工病假申请书
职工病假申请书范文 我们眼下的社会,需要使用申请的场合越来越多,我们在写申请书的时候要注意态度要诚...
农村土地复垦申请书
农村土地复垦申请书精选 xxx镇政府: xxx市土地局: xxx镇xx村位于同河南岸,地处丘陵...
助学金申请书格式
助学金申请书格式(精选15篇) 在眼下市场经济活跃的社会,申请书应用范围广泛,正确运用申请书可以达...
关于企业法人变更申请书
关于企业法人变更申请书 一、申请书的注意事项 (1)申请的事项要写清楚、具体,涉及的数据要准确无...
车费报销申请书
车费报销申请书 篇一:车费报销申请书尊敬的公司领导: 您好!我是公司文员xx。根据公司的'安排,...
高中生走读申请书
高中生走读申请书(通用5篇) 在社会不断进步的今天,申请书与我们不再陌生,申请书是承载我们愿望和请...
大学生自主实习的申请书
大学生自主实习的申请书(通用7篇) 在这个高速发展的时代,申请书在生活中的使用越来越广泛,请注意不...
预支款申请书
预支款申请书范本 篇一:预 支 款 申 请 单 预付款申请书 致***: 我公司承建贵司 *...
房屋质量鉴定申请书
房屋质量鉴定申请书房屋质量鉴定申请书委托编号:委托信息 委托时间 委托人身份联系地址 联系电话委托鉴...